More Workers Are Quitting Their Jobs in Red States With Low Union Rates
Talk of the “Great Resignation“ is everywhere. But a close look at the numbers reveals something interesting: more workers are quitting their jobs in Trump-voting states with low unionization rates than in states with high unionization rates that rejected Trump.

Quit rates are higher in states with the lowest union density and lower in states with higher union density. (Audtakorn Sutarmjam / EyeEm / Getty Images)
I’m not sure what this means, but quit rates are higher in states that voted for Trump, and are higher in states with low unionization rates.
We’ve been hearing for some time now that quit rates are the highest on record. That’s true if you look only at the Job Openings and Labor Market Turnover Survey (JOLTS) numbers, which the Bureau of Labor Statistics (BLS) started reporting in December 2000. It had an ancestor, which the BLS reported for manufacturing only, covering 1919 to 1981 (left portion of the graph below). Current quit rates now are comparable to those of the 1960s and 1970s, and are well below peaks of the 1920s and 1940s. Much of the JOLTS history (right portion of graph below) covers, other measures show, an unusually torpid period for the US job market, so today’s levels may only mark a return to once-familiar territory.

In any case, quit rates are high by contemporary standards. In February, 2.9% of all workers, and 3.2% of all private sector workers, quit their jobs, slightly off highs set late last year.
But quit rates vary widely from state to state, as this map shows. Generally they’re lowest in the Northeast and highest in the South and interior West.
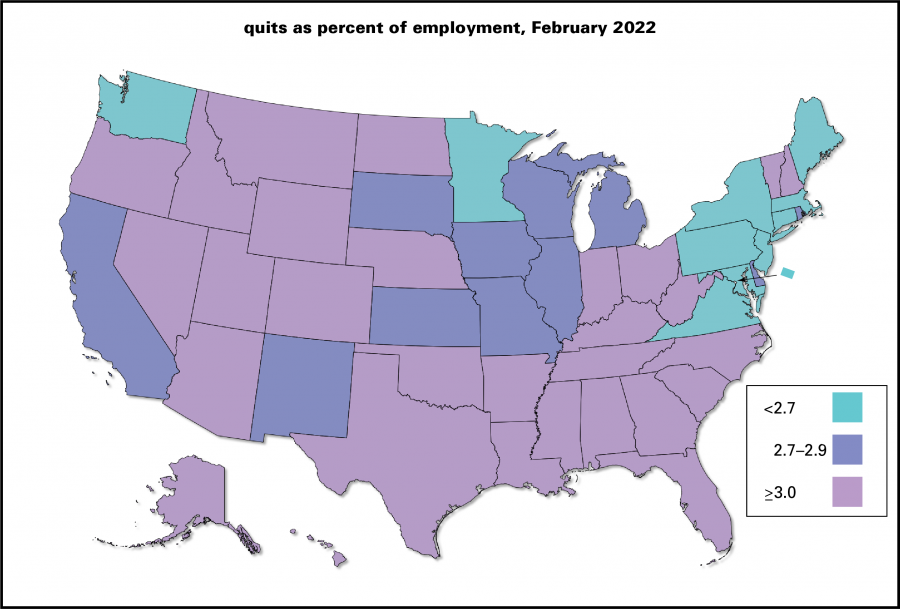
If you’re so inclined, you might notice that this map bears some resemblance to the classic red–blue political map.

And that impression is borne out when you run the numbers. In states with quit rates above the national median, Trump got 57% of the vote; in those around the median, 49%; in those below the median, 42%. (His overall share was 47%.)

And here’s another curious detail: quit rates are higher in states with the lowest union density (the share of the workforce that belongs to unions), and lower in states with higher union density. In states with above-average quit rates, union density averaged 7.8%; in those with below-average quit rates, density was 12.5%. (The national average is 10.3%.) The relationship also held with the top ten and bottom ten states.

So what’s going on here? Do Republican and less unionized states have more dynamic labor markets or fewer discontented workers? Are high quit rates a sign of worker strength or desperation?
Maybe the most productive way to think about this comes from Chris Smalls, the leader of the Amazon Labor Union on Staten Island: “If I can lead us to victory over Amazon, what’s stopping anybody in this country from organizing their workplace? Nothing. You know, people got to get out of that mentality of, ‘Oh, let me just quit my job.’ Because when you quit your job, guess what? They hire somebody else. So you’re jumping from one fire into the next, and the system doesn’t get fixed by doing that.”