Dalton Trumbo’s Taxes
On the Hollywood blacklist and Dalton Trumbo’s marginal tax rate.

Dalton Trumbo Leaving Witness Stand
I filed my taxes in my customarily last-minute fashion, and it got me in the mood for some tax blogging. Via Sarah Jaffe, I came upon the following interesting passage from Victor Navasky’s history of the Hollywood blacklist, Naming Names:
Conversely, during the blacklist years, which were also tight money years for the studios, agents often found it simpler to hint to their less talented clients that their difficulties were political rather than intrinsic. Since agents as a class follow the money, it is perhaps a clue to the environment of fear within which they operated that, for example, the Berg-Allenberg Agency was, even in late 1948, ready, eager, willing, and able to lose its most profitable client, Dalton Trumbo (at $3000 per week he was one of the highest paid writers in Hollywood) — and this even before the more general system of blacklisting had gone into effect.
The first thing that struck me about this that wow, that’s a lot of money. It’s not clear where the figure came from. But Navasky did interview Trumbo for the book, so I have to assume it came from the man himself. Now, presumably Trumbo wasn’t working all the time, but rather getting picked up for various jobs with slack periods in between. But supposing for a moment that he did: $3,000 a week (or $156,000 a year) would be a pretty cushy life now, so it would have been an astronomical amount of money in 1948. (And it’s highly likely that there were people in Hollywood who were making that much. Ben Hecht is said to have gotten $10,000 a week.)
The second thing is to note that even being as rich and famous as Dalton Trumbo wasn’t enough to protect him from the blacklist. In general, of course, the rich stick together and protect their own. But there are some lines you still can’t cross, and the blacklist was one of them. In the end, ideological discipline trumped the solidarity of rich people. Which is what makes the rare radical defectors from the ruling class so significant.
But my final thought was, I wonder what Trumbo’s net income would have been, had he made that much money? After all, that was the heyday of high marginal tax rates in the United States, those legendary 90% tax brackets that seem so unimaginable to people now. So I got to wondering how much Trumbo would have paid in taxes then, and how much he would have paid on a comparable amount of money today.
Fortunately, the Tax Foundation provides excellent data on historical tax rates. I used the spreadsheet here, which describes the federal income tax regimes from 1913 to 2013. Using that data, we can get a rough approximation of how much our hypothetical Dalton Trumbo would have paid in taxes, although of course it doesn’t take into account any particular deductions or loopholes that may have played into an individual situation — and it’s well known that few people actually paid the very high marginal rates of that time. So take this as a quick sketch, meant to demonstrate two things. First, how much our tax rates have changed, and second, how marginal tax rates really work.
Here’s a table showing how Trumbo’s income would have broken down in 1948. Each line shows a single tax bracket. The first three lines show that rate at which income in that bracket was taxed, and the lower and upper bounds that defined which income was taxed at that rate. The last two columns show how much income Trumbo received in each bracket, and how much tax he would have owed on it.
| Tax Rate | Over | But Not Over | Income | Taxes |
|---|---|---|---|---|
| 20.0% | $0 | $2,000 | $2,000 | $400.00 |
| 22.0% | $2,000 | $4,000 | $2,000 | $440.00 |
| 26.0% | $4,000 | $6,000 | $2,000 | $520.00 |
| 30.0% | $6,000 | $8,000 | $2,000 | $600.00 |
| 34.0% | $8,000 | $10,000 | $2,000 | $680.00 |
| 38.0% | $10,000 | $12,000 | $2,000 | $760.00 |
| 43.0% | $12,000 | $14,000 | $2,000 | $860.00 |
| 47.0% | $14,000 | $16,000 | $2,000 | $940.00 |
| 50.0% | $16,000 | $18,000 | $2,000 | $1,000.00 |
| 53.0% | $18,000 | $20,000 | $2,000 | $1,060.00 |
| 56.0% | $20,000 | $22,000 | $2,000 | $1,120.00 |
| 59.0% | $22,000 | $26,000 | $4,000 | $2,360.00 |
| 62.0% | $26,000 | $32,000 | $6,000 | $3,720.00 |
| 65.0% | $32,000 | $38,000 | $6,000 | $3,900.00 |
| 69.0% | $38,000 | $44,000 | $6,000 | $4,140.00 |
| 72.0% | $44,000 | $50,000 | $6,000 | $4,320.00 |
| 75.0% | $50,000 | $60,000 | $10,000 | $7,500.00 |
| 78.0% | $60,000 | $70,000 | $10,000 | $7,800.00 |
| 81.0% | $70,000 | $80,000 | $10,000 | $8,100.00 |
| 84.0% | $80,000 | $90,000 | $10,000 | $8,400.00 |
| 87.0% | $90,000 | $100,000 | $10,000 | $8,700.00 |
| 89.0% | $100,000 | $150,000 | $50,000 | $44,500.00 |
| 90.0% | $150,000 | $200,000 | $6,000 | $5,400.00 |
| 91.0% | $200,000 | – | $0 | $0.00 |
This is a nice illustration of how marginal tax rates work. There is still, unbelievably, widepread confusion about this. People think that if the marginal tax rate is 90% on income over $150,000 — as it was in 1948 — then that means you’ll only keep 10% of all your income if you make that much money. But Trumbo wouldn’t pay 90% on all of his $156,000, only on the $6000 that was over the $150,000 threshold.
So what was Trumbo’s real, overall tax rate? The tax figures above sum up to a total bill of $117,220. The Tax Foundation data also describes some additional reductions that were applied that year: 17% on taxes up to $400, 12% on taxes from $400 to $100,000, and 9.75% on taxes above $100,000. Taking those reductions into account, the tax bill comes down to $103,521.
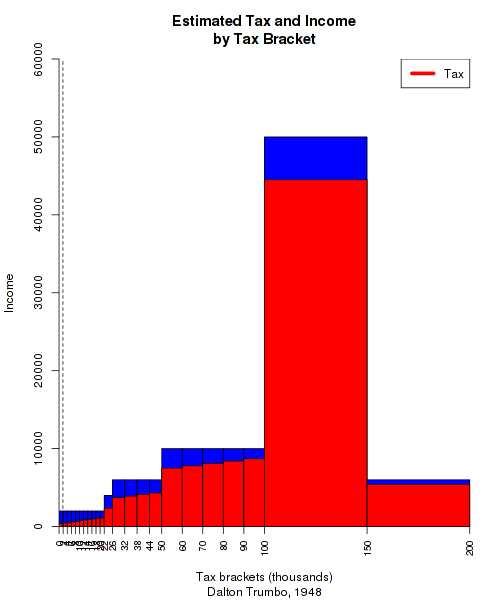
So Trumbo would have had a net income of $52,479 in 1948, for an effective tax rate of 66%. Now, that’s not 90%, but some will surely say that this seems like an unreasonably high level, for reasons of fairness or work incentives or whatever. But let’s keep in mind just how where our Trumbo falls in the 1948 United States’ distribution of income. Here’s a graphical representation of the above data:
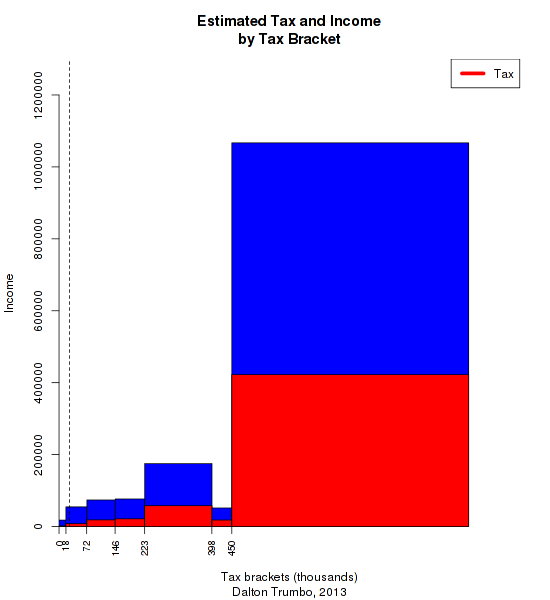
Each bar is a tax bracket. The width of the bar shows how wide the bracket is, while the height shows the income earned in that bracket. The red-shaded portion shows how much of that income was paid in tax. This is a bit visually misleading, because the amount of income in each bar corresponds only to the height of the box, not its volume. But I’ll swallow my data-visualization pride for the sake of a quick blog post.
A few things to note about this graph. You can see how much of the income in the higher brackets was taxed away, due to the extremely high rates there. You can also see that the tax system is progressive, because the height of the red bars slopes upward, even when the amount of money contained in the brackets remains the same. But the most important thing to pay attention to is that dotted line that you can barely see on the far left. That’s the median personal income in the United States for 1948, which according to the Census Bureau was around $1900. In other words, almost all of this would have been irrelevant to half the population, who would have paid just the lowest rate, 20%, on all of their income.
If we adjust Trumbo’s income for inflation with the Consumer Price Index, his income would be equivalent to over 1.5 million dollars today. And the tax bill would have been over 1 million dollars. But how would that kind of pay be taxed now? Here’s a table like the one above, except applying current tax rates to Trumbo’s inflation-adjusted pay:
| Tax Rate | Over | But Not Over | Income | Taxes |
|---|---|---|---|---|
| 10.0% | $0 | $17,850 | $17,850 | $1,785.00 |
| 15.0% | $17,850 | $72,500 | $54,650 | $8,197.50 |
| 25.0% | $72,500 | $146,400 | $73,900 | $18,475.00 |
| 28.0% | $146,400 | $223,050 | $76,650 | $21,462.00 |
| 33.0% | $223,050 | $398,350 | $175,300 | $57,849.00 |
| 35.0% | $398,350 | $450,000 | $51,650 | $18,077.50 |
| 39.6% | $450,000 | $1,066,944 | $422,509.82 |
What a difference sixty-five years and two generations of neoliberalism makes! Now Trumbo’s effective tax rate is only 36.15%, and he takes home $968,000 after a $548,000 tax bill. To finish things up, here’s a graphical representation like the one above: 
This time, most of the income falls into the top bracket. But since the rate there is only 39.6%, our hypothetical 2013 Trumbo still keeps most of his money. And once again, these brackets are mostly irrelevant to most of the population — note the line marking median income.
The punchline to this story, of course, is that it was things like the Hollywood blacklist that helped set the stage for the period of conservative reaction that gave us these tax rates.
Check this nice documentary on Dalton Trumbo to get a sense of a Hollywood radical who puts most of our contemporary celebrity liberals to shame. The spreadsheet used to estimate these figures is here, if you care to play with it yourself.
