US Workers Are Striking Again
Halfway through the year, the number of large strikes in the United States is at the highest level in decades.

Arizona teachers march through downtown Phoenix on their way to the State Capitol as part of a rally for the #REDforED movement on April 26, 2018 in Phoenix, Arizona. Ralph Freso / Getty
In the 1980s there was a phrase used to describe the increasing unwillingness of US labor unions to go on strike. In the disastrous 1981 air traffic controllers’ strike, over ten thousand members of the Professional Air Traffic Controllers Association (PATCO) were fired by President Reagan. That was seen as the beginning of a rougher era of union-busting and increasingly adversarial labor relations, and large strikes in the US fell in the following years. The phrase “PATCO Syndrome” came to describe the fear of striking and losing.
In reality, US labor relations have never been cordial and large strikes have been declining since the 1970s. The Bureau of Labor Statistics (BLS) releases a report early every year of the number of large work stoppages the previous year. BLS defines large work stoppages as “involving 1,000 or more workers lasting one full shift or longer.” In counting work stoppages, it includes strikes and lockouts (where the employer refuses to let the union members work), but the list is usually mostly strikes. In 2017, BLS released this stunning chart summarizing seventy years of collecting this data.
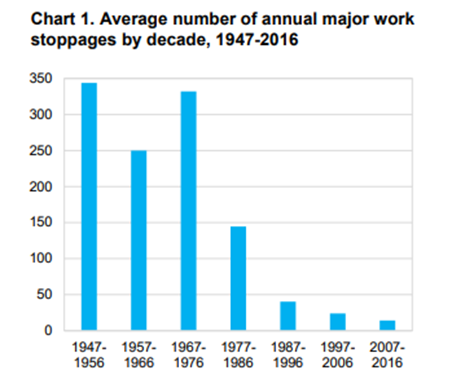
Clearly, the number of large strikes has plummeted. For the thirty-year period starting in the mid-1940s, the average number of annual strikes was over three hundred per year. That means on almost every day in that era a large strike would start. The average in the most recent decade has been about fourteen per year. Continuing this trend, the BLS’s most recent report listed only seven large strikes for 2017, the second lowest on record after 2009.
There is another record of strikes maintained by the Federal Mediation and Conciliation Service (FMCS). It tracks work stoppages of all sizes related to contract bargaining in the private sector, though it also seems to include some public sector strikes as well. A full analysis of this data needs to be done, and it’s not clear to me at this point how complete it is.
Do Strikes Matter?
Does any of this matter? It does if we’re interested in a labor movement that successfully fights to raise standards for its members and the working class as a whole. That thirty-year post-WWII era of striking coincides closely with the years of large union membership, higher union density (the percentage of workers who are union members), rising average working-class wages and decreasing inequality in society. The years ever since have seen a reverse of these trends, as I’ve discussed elsewhere. In the 1950s union density was about one-third of all workers, and in that era, strike activity grew the labor movement which made it stronger and therefore able to strike more. Today, union density is about 11 percent, and we’ve been in a downward cycle where unions strike less and grow weaker over time. This chart, put together by Doug Henwood, shows union density over time:

That’s why it’s fascinating that in 2018, we’re seeing a dramatic increase in the number of large work stoppages. I count sixteen for the first half of the year, including one lockout, which if this trend continues, puts us on track for thirty-two for the full year. The number of large work stoppages has not been thirty or more since the year 2000.
What accounts for this increase in strike activity? These strikes have been led by statewide teachers’ walkouts in a half dozen states. These states have seen Republican takeovers and education funding budget cuts. The teachers’ wages were at the lower end among the states and at some point they said enough was enough. Another factor has to be the very low unemployment rate of 4.1 percent or lower this year. Though the official publicized unemployment figures tend to undercount true unemployment levels, there is no doubt that it has been trending lower over time. This means employers have a harder time finding workers, and workers and can’t be as easily replaced which means they have more bargaining power. Indeed, the teachers in a number of states have pointed out the huge numbers of vacant teaching positions.
Ironically, this surge in striking occurs during the year of the recent anti-union Supreme Court Janus decision, which mandates “right to work” rules for all public sector workers. I have previously estimated that over 600,000 workers could drop their union membership and avoid paying any union dues or fees. That will weaken the labor movement, but we have seen how a “right to work” environment has not stopped public sector strikes in many states, and there are indications that several unions have gained membership this year in “right to work” states through these struggles. The best union solution to “right to work” attacks is to fight and win.
Here is my list of large work stoppages for the first half of 2018, in rough chronological order, which also includes the one lockout. This data is from news articles, union websites, and the FMCS data. In some cases, it’s not clear how many workers were on strike, but I believe from available information that all of these involved over a thousand workers, and the state teachers’ strikes involved tens of thousands. It’s possible that BLS may not count some of these teachers’ strikes if they are considered a mass protest where teachers took sick days or where superintendents closed schools for the day, so we’ll have to see. And I have followed the BLS protocol of counting multiple unions striking at a single employer as a single strike.
It’s interesting that almost all of these involved education and telecommunications industry workers. Check out the support actions for the IBEW Spectrum strike, and the solidarity petition for the Steelworkers National Grid lockout.
