The Profit Hoarders
American corporations are rolling in enormous profits. But they still aren't investing.

Attendees at the 2011 Walmart shareholders' meeting. Walmart / Flickr
In a post earlier this week, I showed how public investment, net of depreciation, in the US is barely above zero, meaning that fresh expenditures on long-lived assets like schools and roads are running just slightly ahead of the decay of existing infrastructure. You might think, given neoliberal orthodoxy, that the private sector is taking up the slack. It isn’t.
The graph below shows net private nonresidential fixed investment as a percent of GDP. Net means less depreciation (the declining monetary value of existing assets over time, as they wear out and grow obsolete); private means not-government; nonresidential should be self-explanatory; and fixed means sticking around, as opposed to inventories, which are considered a form of investment, since businesses accumulate them for later sale.
Several things stand out from the graph. First, the declining trend lines on both total investment and investment in equipment, and the slow rise in intellectual property investment. Investment in equipment and software — machinery, computers, telecommunications equipment, etc. — is particularly crucial to long-term productivity growth. Although the fruits of productivity growth can be distributed in any number of ways, like higher profits and/or higher wages, the growth in productivity (meaning the dollar value of an hour of labor) puts an upper limit on income growth over the long term.
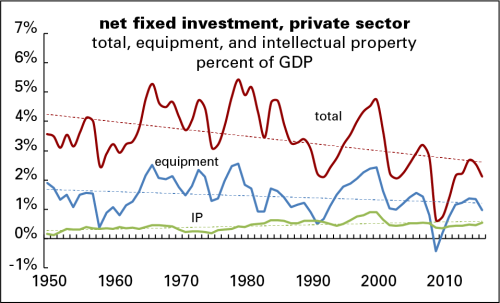
At 2.1% of GDP in 2016, total net fixed investment is just over half its 1950–2000 average of 3.8%; at 1% of GDP, investment in equipment is more than a third below its average over the same period of 1.6%. (Preliminary figures for 2017 show little change from 2016 levels.) The recent peak of 2.7% in total investment, set in 2014, was below the recession lows of 1975 and 1983, and matches the recession low of 2003. In other words, in the best recent year, corporations invested at a rate matched or exceeded in earlier bad years. Not graphed is investment in structures — like factories, office buildings, and warehouses — whose trajectory is very similar to equipment. Its 2016 share of GDP, 0.6%, was a third its 1950–2000 average.
Intellectual property (IP) investment deserves a few words. It’s been rising as a share of GDP, but it remains a tiny 0.5%.
When it comes to its social benefits, it’s a mixed bag. About half of it, 47% in 2016, is accounted for by software, both commercial and custom-made. Some software is useful, like the WordPress code that makes this blog possible and the Excel and Illustrator code that made the above graph possible, but some is overpriced and bloaty, like the monstrosities that many universities run on.
A bit less, 42% last year, is research and development (R&D). Some R&D produces useful products, but an awful lot of it is just the pursuit of rents from branding and patent scheming. (The leading culprit here is the pharmaceutical industry, whose basic research is largely funded by governments and universities; drug companies just come up with patentable products they can charge a bundle for.)
And the remaining 11% is accounted for by “entertainment, literary, and artistic originals,” which includes Game of Thrones and Taylor Swift’s recorded oeuvre. While these can produce pleasure, their contribution to long-term prosperity is hard to measure.
These low rates of investment are not driven by corporations’ lack of money; though profits are down from their peak several years ago, Corporate America is still rolling in it. But they’re not investing the profits. Instead, they’ve been shipping out gobs of money to their shareholders — an average of $1.2 trillion a year since 2015. These shareholder transfers take the form of traditional dividends and stock purchases — purchases of other firms’ stock in takeovers, and of their own in efforts to boost their prices.
If corporations returned to the practices of the pre-neoliberal era (1952–1983, to be precise), stuffing not half but less than a fifth of their cash flow in their shareholders’ pockets, that could take net investment back to its old average. But under today’s model of capitalism, it’s more important to keep the shareholders happy.